Abstract
OBJECTIVES: Examine fatal and nonfatal firearm injuries among children aged 0 to 17 in the United States, including intent, demographic characteristics, trends, state-level patterns, and circumstances.
METHODS: Fatal injuries were examined by using data from the National Vital Statistics System and nonfatal injuries by using data from the National Electronic Injury Surveillance System. Trends from 2002 to 2014 were tested using joinpoint regression analyses. Incident characteristics and circumstances were examined by using data from the National Violent Death Reporting System.
RESULTS: Nearly 1300 children die and 5790 are treated for gunshot wounds each year. Boys, older children, and minorities are disproportionately affected. Although unintentional firearm deaths among children declined from 2002 to 2014 and firearm homicides declined from 2007 to 2014, firearm suicides decreased between 2002 and 2007 and then showed a significant upward trend from 2007 to 2014. Rates of firearm homicide among children are higher in many Southern states and parts of the Midwest relative to other parts of the country. Firearm suicides are more dispersed across the United States with some of the highest rates occurring in Western states. Firearm homicides of younger children often occurred in multivictim events and involved intimate partner or family conflict; older children more often died in the context of crime and violence. Firearm suicides were often precipitated by situational and relationship problems. The shooter playing with a gun was the most common circumstance surrounding unintentional firearm deaths of both younger and older children.
CONCLUSIONS: Firearm injuries are an important public health problem, contributing substantially to premature death and disability of children. Understanding their nature and impact is a first step toward prevention.
- Abbreviations:
- APC —
- annual percent change
- CDC —
- Centers for Disease Control and Prevention
- ED —
- emergency department
- NEISS —
- National Electronic Injury Surveillance System
- NVDRS —
- National Violent Death Reporting System
What’s Known on This Subject:
Firearm-related deaths are the third leading cause of death overall among US children aged 1 to 17 years and the second leading cause of injury-related death. Previous studies examined selected outcomes or certain types of firearm injuries.
What This Study Adds:
This is the most comprehensive analysis of firearm-related deaths and injuries among US children to date, examining overall patterns, patterns by intent, trends over time, state-level patterns, and precipitating circumstances. These findings underscore the need for scientifically sound solutions.
Recent evidence from the National Survey of Children’s Exposure to Violence indicates that 4.2% of children aged 0 to 17 in the United States have witnessed a shooting in the past year.1Children across the United States also directly experience the fatal and nonfatal consequences of firearm violence. Firearm-related deaths are the third leading cause of death overall among US children aged 1 to 17 years, surpassing the number of deaths from pediatric congenital anomalies, heart disease, influenza and/or pneumonia, chronic lower respiratory disease, and cerebrovascular causes.2 They are the second leading cause of injury-related death in this age group, surpassed only by motor vehicle injury deaths.2
Previous studies of firearm injuries among children have examined selected outcomes (eg, deaths, hospitalizations, or emergency department [ED] visits for nonfatal firearm injuries)3–7 or certain types of firearm injuries (eg, homicides and assaults, unintentional firearm injuries).8–10 This article provides the most comprehensive examination of current firearm-related deaths and injuries among children in the United States to date. It examines overall patterns of firearm-related death and injury, patterns by type of firearm injury (interpersonal, self-directed, and unintentional), trends over time, state-level patterns, and circumstances surrounding these deaths. The findings underscore the need for scientifically sound solutions to address this important public health problem.
Methods
A firearm injury is defined as a gunshot wound or penetrating injury from a weapon that uses a powder charge to fire a projectile. This definition includes gunshot injuries sustained from handguns, rifles, and shotguns but excludes gunshot wounds from air- and gas-powered guns, BB guns, and pellet guns, as well as nonpenetrating injuries associated with firearms (eg, “pistol whipping”).
New data were not collected for these analyses. National data on fatal firearm injuries were derived from death certificate data from the Centers for Disease Control and Prevention’s (CDC) National Vital Statistics System, and were obtained via the CDC’s Web-based Injury Statistics Query and Reporting System.2 Firearm deaths were defined by using one of the following underlying cause of death codes from the International Classification of Diseases, 10th Revision: W32-W43 (unintentional firearm deaths), X72-X74 (firearm suicides), X93-X95 (firearm homicides), Y22-Y24 and U01.4 (firearm deaths of undetermined intent), and Y35.0 (legal intervention deaths by firearm). Firearm deaths were examined for children aged 0 to 17 years by known intent (homicide, suicide, unintentional), race and ethnicity, and state. State-level data include deaths of state residents only and exclude deaths of nonresidents, even if the fatal injury occurred within the state in question. Firearm suicides are reported for children aged 10 years and older given how rare they are in children younger than age 10 (ie, 5 cases for the nation over the period 2000–2014)2 and because children <10 years old may not be developmentally capable of fully forming suicidal intent. Given potential differences in exposures for younger children (0–12 years) compared with older children (13–17 years), the data were stratified by age group where possible.
Data on nonfatal firearm injuries are from the National Electronic Injury Surveillance System (NEISS) operated by the US Consumer Product Safety Commission.11 NEISS is a stratified probability sample of US hospitals that have an ED and a minimum of 6 beds, representing large urban, suburban, rural, and children’s hospitals. Nonfatal injury estimates have been adjusted to account for hospital nonresponse and changes in the number of US hospital EDs over time. NEISS classifies injury intent by using standard definitions for the following categories: assault, self-harm, unintentional, and legal intervention. Self-harm data are reported only for children aged 10 years and older (see previous note). Information on nonfatal injury by racial and ethnic group is not presented here because of large amounts of missing race and ethnicity data.12 NEISS data are collected on the basis of a national probability sample and sample weights are summed to provide national estimates; valid regional- and state-level estimates cannot be obtained from these data.
Data on circumstances and other incident characteristics for firearm homicide, firearm suicide, and unintentional firearm deaths among children were derived from the National Violent Death Reporting System (NVDRS). NVDRS is an active, state-based surveillance system started in 2003 that collects information on all violent deaths and unintentional firearm deaths within participating states from 3 primary sources: death certificates, coroner and/or medical examiner records, and law enforcement reports. NVDRS collects detailed information about the context and circumstances of these deaths, including victim and perpetrator characteristics. This analysis includes data from 2003 to 2013 for the 17 NVDRS states funded during this time period (AK, CO, GA, KY, MA, MD, NJ, NM, NC, OH, OK, OR, RI, SC, UT, VA, and WI). States joined the NVDRS system in different years13; data for each state were included for all available years. Pearson χ2 tests were used to test the statistical significance of differences in NVDRS circumstance counts between younger (aged 0–12 years) and older (aged 13–17 years) children for firearm homicide and unintentional firearm deaths.
Crude rates per 100 000 children were calculated by using US Census bridged-race population estimates. To derive the average annual number of nonfatal firearm injuries, national estimates for each year from 2012 to 2014 were summed and divided by 3. Similar calculations were made to derive the average annual number of firearm deaths by using unweighted data and annualized mortality rates. Additional years of data (2010–2014) were used for the state maps to provide stable estimates at the state level. SAS and joinpoint regression analyses were used to test the significance of trends across the period from 2002 to 2014. Annual percent change (APC) estimates that were statistically significant at P < .05 are presented to indicate the magnitude and direction of significant trends in firearm death rates.
Results
The Extent of Firearm Injuries and Deaths Among Children in the United States
On average, from 2012 to 2014, nearly 1300 children (N = 1297) died each year in the United States from a firearm-related injury, for an annual crude rate of 1.8 per 100 000 (Table 1). Fifty-three percent of these were homicides (n = 693), 38% were suicides (n = 493), and 6% were unintentional firearm deaths (n = 82); the remaining 3% were due to legal intervention (n = 9) and deaths of undetermined intent (n = 19). The annual rates of firearm homicide (2.6 per 100 000) and firearm suicide (2.3 per 100 000) were roughly equivalent among the older age group (aged 13–17 years) and were 15 to 17 times higher than the unintentional firearm death rate for this group. For the younger group (aged 0–12 years), the annual rate of firearm homicide (0.3 per 100 000) was over 3 times higher than the rate of unintentional firearm deaths. As noted previously, suicide rates were calculated only for children aged 10 years and older; therefore, they cannot be directly compared. During the same period, an average of 5790 children each year received medical treatment in an ED for a firearm-related assault, an act of self-harm, or from an unintentional firearm injury, for an average annual rate of 7.9 per 100 000.
TABLE 1
Average Annual Fatal and Nonfatal Child Firearm Injuries and Rates by Sex, Age Group, Race, and Ethnicity: United States, 2012–2014
| Fatal Firearm Injuries, N (%) | Rate per 100 000a | |||||||
|---|---|---|---|---|---|---|---|---|
| Allb | Homicide | Suicidec | Unintentional | Allb | Homicide | Suicide | Unintentional | |
| Total | 1297 (100.0) | 693 (100.0) | 493 (100.0) | 82 (100.0) | 1.76 | 0.94 | 1.48 | 0.11 |
| Sex | ||||||||
| Boys | 1067 (82.3) | 550 (79.4) | 421 (85.4) | 69 (84.1) | 2.84 | 1.46 | 2.48 | 0.18 |
| Girls | 230 (17.7) | 143 (20.6) | 72 (14.6) | 13 (15.9) | 0.64 | 0.40 | 0.44 | 0.04 |
| Age group | ||||||||
| 0–12 | 229 (17.7) | 150 (21.7) | 24c (4.8) | 50 (60.6) | 0.43 | 0.28 | 0.19 | 0.09 |
| 13–17 | 1068 (82.3) | 543 (78.3) | 469 (95.1) | 32 (39.4) | 5.11 | 2.60 | 2.25 | 0.15 |
| Race and ethnicityd | ||||||||
| White | 601 (46.3) | 141 (20.3) | 404 (81.9) | 45 (54.9) | 1.50 | 0.35 | 2.18 | 0.11 |
| African American | 457 (35.2) | 389 (56.1) | 31 (6.3) | 26 (31.7) | 4.10 | 3.49 | 0.62 | 0.23 |
| Hispanic | 204 (15.7) | 148 (21.4) | 41 (8.3) | 9 (11.0) | 1.15 | 0.83 | 0.55 | 0.05 |
| American Indian | 16 (1.2) | 7 (1.0) | 7 (1.4) | 2 (2.4) | 2.15 | — | 2.19 | — |
| Asian American | 15 (1.2) | 7 (1.0) | 8 (1.6) | <1 (<1.0) | 0.39 | 0.18 | 0.44 | — |
| Nonfatal Firearm Injuries, n (%) | Rate per 100 000a | |||||||
| Alle | Assault | Self-harm | Unintentional | Alle | Assault | Self-harm | Unintentional | |
| Total | 5790 (100.0) | 4102 (100.0) | 170 (100.0) | 1244 (100.0) | 7.86 | 5.57 | 0 | 1.69 |
| Sex | ||||||||
| Boys | 4850 (83.8) | 3464 (84.5) | 158 (92.9) | 1012 (81.3) | 12.89 | 9.21 | 0 | 2.69 |
| Girls | 940 (16.2) | 637 (15.5) | 12 (7.1) | 233 (18.7) | 2.61 | 1.77 | 0 | — |
| Age group | ||||||||
| 0–12 | 684 (11.8) | 279 (6.8) | — | 382 (30.7) | 1.30 | — | 0 | — |
| 13–17 | 5106 (88.2) | 3823 (93.2) | 170 (100.0) | 862 (69.3) | 24.45 | 18.30 | 0 | 4.13 |
-
National Vital Statistics System (fatal firearm injuries), NEISS (nonfatal injuries). All estimated injuries reported represent annualized (average) numbers; hence, they may not sum to total because of rounding.
-
↵a Rates are considered unreliable when the rate is calculated with a numerator of 20 or fewer cases (for the 3 years 2012–2014). Unreliable rates are suppressed.
-
↵b In addition to the firearm-related deaths classified as homicide, suicide, and unintentional, the count for all firearm-related deaths includes those deaths classified as undetermined and legal intervention.
-
↵c Rates per 100 000 for firearm suicide deaths are calculated by using population estimates for persons 10 years of age and older. Suicide deaths in the 0 to 12-year-old age group therefore reflect only decedents aged 10 years and older. N = 2 children under the age of 10 who died by firearm suicide across all years represented.
-
↵d All race/ethnicity groups are non-Hispanic other than ‘Hispanic,’ which includes persons of any race with Hispanic ethnicity indicated.
-
↵e In addition to the nonfatal firearm injuries classified as assault, self-harm, and unintentional, the count for all nonfatal firearm injuries includes those injuries classified as undetermined and legal intervention.
Firearm injuries have among the highest case fatality rates of most illnesses or injuries. The case fatality rate (ie, the proportion of cases resulting in death), however, varies by intent. From 2012 to 2014, the average annual case fatality rate was 74% for firearm-related self-harm, 14% for firearm-related assaults, and 6% for unintentional firearm injuries.
Which Children Are Most at Risk for a Firearm-Related Injury?
Boys disproportionately bear the burden of firearm mortality, accounting for 82% of all child firearm deaths. The annual rate of firearm death for boys from 2012 to 2014 was 4.5 times higher than the annual rate for girls (2.8 vs 0.6 per 100 000) (Table 1); this difference was even more pronounced by age, with the rate for 13- to 17-year-old boys being 6 times higher than the rate for same-aged girls (8.6 vs 1.4 per 100 000; data not shown). During this period, the annual rate ratio of the boy versus girl firearm homicide rate was ∼4:1, for firearm suicide it was ∼6:1, and for unintentional firearm deaths it was 4.5:1.
Older children (aged 13–17 years) had a rate of fatal firearm injury that was more than 12 times higher than the rate for younger children (aged 0–12 years): 5.1 per 100 000 vs 0.4 (Table 1). The magnitude of differences between older and younger children varies by intent. The annual rate of firearm homicide was ∼10 times higher among 13- to 17-year-olds versus 0 to 12-year-olds (2.6 vs 0.3 per 100 000); unintentional firearm death rates were approximately twice as high when comparing these 2 groups (0.2 vs 0.1 per 100 000). Firearm suicide rates were ∼11 times higher among 13- to 17-year-olds (2.3 per 100 000) versus 10- to 12-year-olds (0.2 per 100 000).
African American children have the highest rates of firearm mortality overall (4.1 per 100 000), and this disparity is largely a function of differences between racial and ethnic groups in firearm homicide. From 2012 to 2014, the annual firearm homicide rate for African American children (3.5 per 100 000) was nearly twice as high as the rate for American Indian children (2.2 per 100 000), 4 times higher than the rate for Hispanic children (0.8 per 100 000), and ∼10 times higher than the rate for white children and Asian American children (each 0.4 per 100 000).
In contrast with patterns of firearm homicide, white and American Indian children have the highest annual average rates of firearm suicide (each 2.2 per 100 000). From 2012 to 2014, the annual rate of firearm suicide among white and American Indian children was nearly 4 times higher than the rate for African American (0.6 per 100 000) and Hispanic (0.5 per 100 000) children and over 5 times the rate for Asian American children (0.4 per 100 000). From 2012 to 2014, rates of unintentional firearm deaths were between 0.1 and 0.2 per 100 000 across racial and ethnic groups. The rate for African American children was twice as high (0.2 per 100 000) as the rate for white children (0.1 per 100 000) and 4 times the rate for Hispanic children (0.05 per 100 000).
Similar to fatal firearm injuries, boys incur the majority of nonfatal firearm injuries treated in US EDs, accounting for ∼84% of all nonfatal firearm injuries medically treated each year. From 2012 to 2014, the average annual rate of nonfatal firearm injuries for boys was 12.9 per 100 000, or ∼5 times the rate for girls (2.6 per 100 000). Most of these injuries (71%) were from a firearm-related assault. Older children (aged 13–17) accounted for 88% of all nonfatal firearm injuries treated in an ED. The overall average annual rate of nonfatal firearm injuries for older children was ∼19 times the rate for younger children (24.4 vs 1.3 per 100 000).
Where Do Most Firearm Deaths Occur?
Patterns of firearm mortality vary by state (Fig 1). Several states (DE, HI, ME, NH, ND, RI, SD, and VT) had 20 or fewer child firearm deaths (the threshold below which rates are considered unstable because they are based on low counts) over the entire 5-year period from 2010 to 2014. The District of Columbia and Louisiana had the highest rates of child firearm mortality in the nation (4.5 and 4.2 per 100 000 children, respectively). The highest rates of firearm homicide among children were largely concentrated across 7 Southern states (AL, FL, GA, LA, MS, SC, and TN), 4 Midwestern states (IL, MO, MI, and OH), 2 Western states (CA and NV), and 3 Northeastern states (CT, MD, and PA). Firearm suicides among children were more dispersed across the United States. An observable pattern not defined by region is also seen extending from Louisiana, Arkansas, and the upper Midwest to Oklahoma, Kansas, and through the Western states (eg, CO, NM, UT, NV, ID, MT, OR, and WA). Alaska, Montana, and Idaho had the highest rates of child firearm suicides over the 5-year period.

<– FIGURE 1
Firearm death rates among children aged 0 to 17 years, 2010–2014. Firearm deaths are based on the International Classification of Diseases, 10th Revision external cause of injury codes. All firearm deaths include firearm suicide (X72-X74), firearm homicide (X93-X95, U01.4), legal intervention firearm deaths (Y35.0), unintentional firearm deaths (W32-W34), and firearm deaths of undetermined intent (Y22-Y24). Rates of firearm suicide are for children aged 10 to 17 years.
Trends
Trends in firearm death rates for the nation between 2002 and 2014 are depicted in Fig 2. Child firearm homicide rates increased significantly from 2002 to 2007, increasing 17% from 1.2 to 1.4 per 100 000 (APC = 4.6, P < .05), and exhibited a significant decline from 2007 to 2014, decreasing 36% from 1.4 to 0.9 (APC = −6.7, P < .05). Child firearm suicide rates, on the other hand, showed a significant downward trend between 2002 and 2007, decreasing 23% from 1.3 to 1.0 (APC = −4.2, P < .05), but then a significant upward trend between 2007 and 2014, increasing 60% from 1.0 to 1.6 (APC = 6.3, P < .05) to the highest rate seen over the period examined. Unintentional firearm deaths exhibited a significant overall decrease between 2002 and 2014 (APC = −2.7, P < .05).
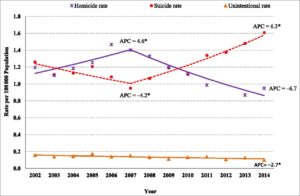 FIGURE 2
Fatal firearm injury rates by intent and year, children aged 0 to 17 years, United States, 2002–2014. Data sourced from CDC/NEISS and US Census Bureau for population estimates. Statistical significance of regression results is indicated as * P < .05.
Circumstances and Other Incident Characteristics
National data on the circumstances surrounding child firearm deaths are not available. Although limited to the 17 states participating in NVDRS during the period of the study, data from NVDRS provide the only detailed and systematically collected circumstance information available regarding the factors surrounding these deaths. These data indicate that during the study period (2003–2013), approximately half of all incidents involving firearm homicides of younger children (aged 0–12 years) had multiple victims versus 13% of incidents with victims aged 13 to 17 years (Table 2). The perpetrator died by suicide in 42% of firearm homicides of younger children versus 6% of cases with older children. Information about the perpetrator’s age was known in 78% of the deaths for younger children and in 54% for older children. Over two-thirds of perpetrators in cases involving younger children were 25 years of age or older. Older children were primarily killed by someone of the same age (13–17 years) or close in age (18–24 years). The vast majority of younger children (85%) were killed in a home, whereas older victims were equally likely to be killed in a home (39%) or on the streets (38%). The majority of younger and older children were killed with a handgun (75% and 85%, respectively).
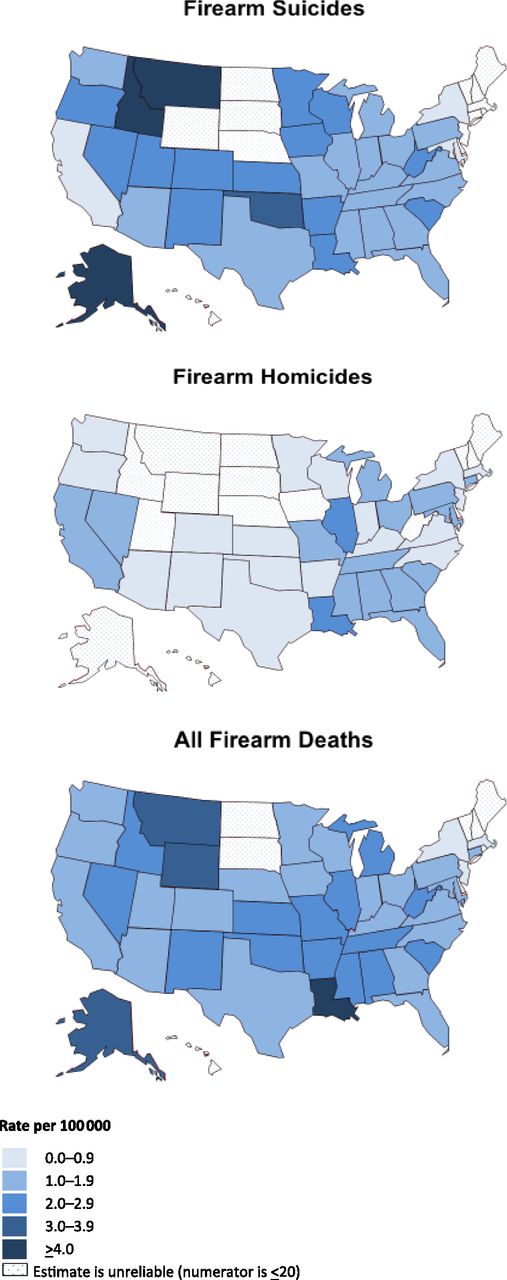
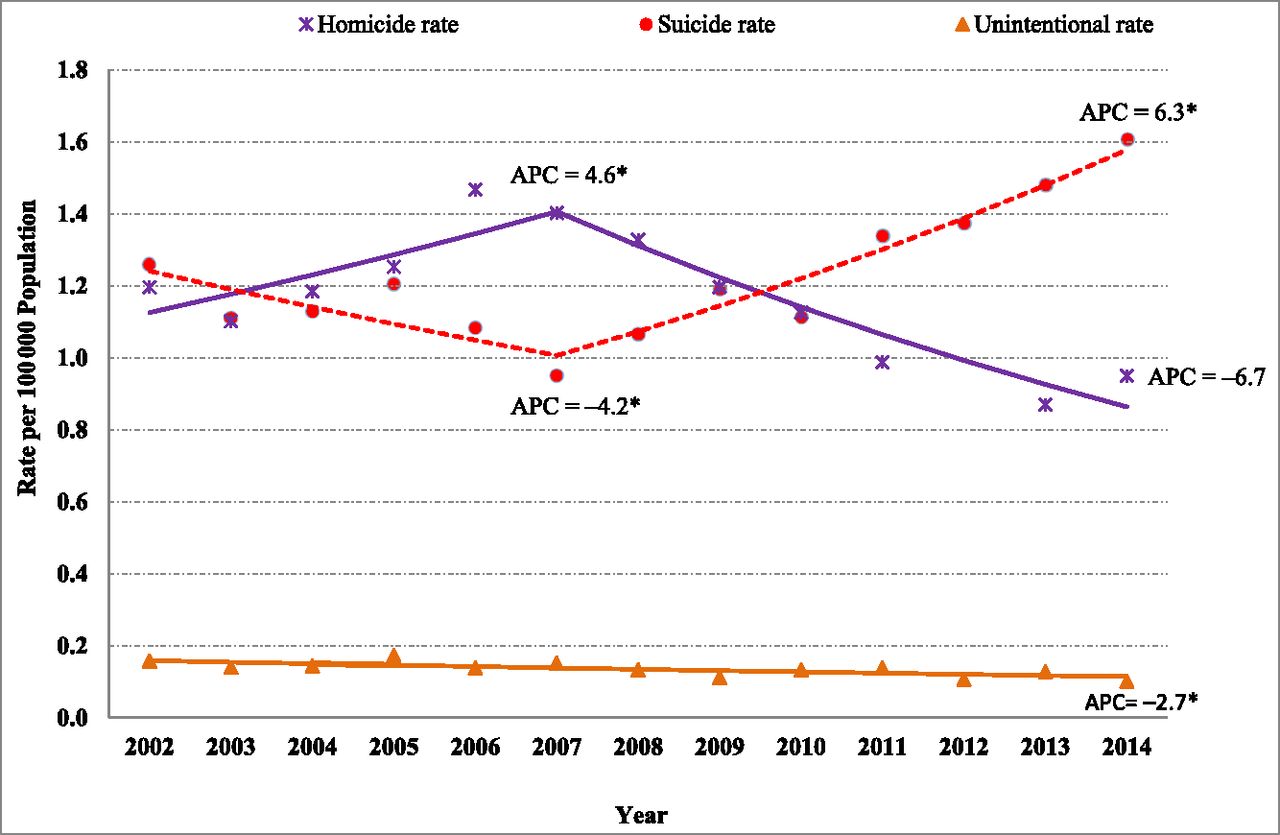
TABLE 2 Circumstances and Other Characteristics of Fatal Firearm Injuries Among Children: NVRS, 17 States, 2003–2013
| Firearm Homicide | Firearm Suicide | Unintentional Firearm Deaths | |||||
|---|---|---|---|---|---|---|---|
| Aged 0–12 | Aged 13–17 | Aged 10–17a | Aged 0–12 | Aged 13–17 | |||
| N = 373 | N = 1588 | N = 1207 | N = 177 | N = 168 | |||
| Circumstances | n = 286 | n = 1114 | Circumstances | n = 1053 | Circumstances | n = 146 | n = 155 |
| Argument | 98 (34%) | 446 (40%) | Life stressors | Playing with gun | 87 (60%) | 76 (49%) | |
| Intimate-partner violence relatedb | 90 (31%) | 89 (8%) | Crisis in the past or upcoming 2 wks | 440 (42%) | Unintentionally pulled trigger | 36 (25%) | 33 (21%) |
| Precipitated by another crime | 79 (28%) | 342 (31%) | Other relationship problem (eg, friend) | 322 (31%) | Other context of injury | 29 (21%) | 36 (23%) |
| Victim was a bystanderb | 42 (15%) | 79 (7%) | Intimate partner problem | 283 (27%) | Thought unloaded or safety engagedb | 24 (16%) | 53 (34%) |
| Gang-relatedb | 13 (5%) | 234 (21%) | School problem | 260 (25%) | Hunting or target shooting | 20 (14%) | 26 (17%) |
| Drive-by shooting | 18 (6%) | 102 (9%) | Family relationship problemc | 145 (14%) | Gun mistaken for a toyd | 24 (16%) | 1 (1%) |
| Crisis in past or upcoming 2 wksb | 20 (7%) | 18 (2%) | Recent criminal or civil legal problem | 109 (10%) | Dropped gun | 11 (8%) | 6 (4%) |
| Drug involvementb | 15 (5%) | 141 (13%) | Argumentc | 97 (9%) | Loading or unloading the gun | 8 (5%) | 14 (9%) |
| Family relationship problemb | 16 (6%) | 16 (1%) | Nonsuicide death of friend or family member | 67 (6%) | Showing gun to othersb | 6 (4%) | 43 (28%) |
| Random violence | 9 (3%) | 26 (2%) | Suicide of friend or family member | 38 (4%) | Cleaning gund | 9 (6%) | 4 (3%) |
| Victim used a weapond | 2 (1%) | 69 (6%) | Mental health or substance use | Defect or malfunctiond | 3 (2%) | 8 (5%) | |
| Jealousy or love triangle | 6 (2%) | 22 (2%) | Current depressed mood | 361 (34%) | |||
| Victim was an intervener assisting a crime victimd | 0 (0%) | 7 (1%) | Current diagnosed mental health problem | 274 (26%) | |||
| Current mental health treatment | 192 (18%) | ||||||
| Alcohol or other substance abuse problem | 172 (16%) | ||||||
| Drugs and/or alcohol present in system | 119 (11%) | ||||||
| Incident characteristics | n = 373 | n = 1588 | Suicide event | n = 1053 | Shootere | n = 151 | n = 152 |
| Involved multiple victims | 174 (47%) | 209 (13%) | Left a suicide note | 404 (38%) | Self | 66 (44%) | 44 (29%) |
| Homicide followed by suicide | 158 (42%) | 92 (6%) | Disclosed intent to commit suicide | 279 (26%) | Other | 85 (56%) | 108 (71%) |
| Previous history of suicide attempts | 103 (10%) | ||||||
| Primary suspect’s age, y | n = 291 | n = 861 | Shooter’s age, y (if “other”) | n = 79 | n = 90 | ||
| <13 | 12 (4%) | 5 (<1%) | <13 | 43 (54%) | 12 (13%) | ||
| 13–17 | 26 (9%) | 218 (25%) | 13–17 | 16 (20%) | 56 (62%) | ||
| 18–24 | 52 (18%) | 410 (48%) | 18–24 | 5 (6%) | 17 (19%) | ||
| 25–34 | 82 (28%) | 102 (12%) | 25–34 | 8 (10%) | 1 (1%) | ||
| 35–44 | 86 (30%) | 64 (7%) | 35–44 | 3 (4%) | 0 | ||
| 45–55 | 29 (10%) | 40 (5%) | 45–54 | 2 (3%) | 1 (1%) | ||
| 55 | 4 (1%) | 22 (3%) | 55+ | 2 (3%) | 1 (1%) | ||
| Location | n = 367 | n = 1569 | Location | n = 1192 | Location | n = 173 | n = 162 |
| House or apartment | 313 (85%) | 614 (39%) | House or apartment | 1022 (86%) | House or apartment | 145 (84%) | 127 (78%) |
| Street, road, sidewalk, or alley | 14 (4%) | 593 (38%) | Street, road, sidewalk, alley | 25 (2%) | Street, road, sidewalk, or alley | 1 (1%) | 4 (2%) |
| Motor vehicle | 11 (3%) | 69 (4%) | Motor vehicle | 22 (2%) | Motor vehicle | 4 (2%) | 3 (2%) |
| Other public location | 23 (6%) | 235 (15%) | Natural area or countryside | 56 (5%) | Natural area or countryside | 17 (10%) | 21 (13%) |
| School (K-12th grade) | 0 | 8 (1%) | School (K-12th grade) | 5 (<1%) | School (K-12th grade) | 0 | 0 |
| Other | 6 (2%) | 50 (3%) | Other | 61 (5%) | Other | 6 (3%) | 7 (4%) |
| Type of gun involved | n = 295 | n = 1032 | Type of gun involved | n = 1117 | Type of gun involved | n = 150 | n = 145 |
| Handgun | 221 (75%) | 881 (85%) | Handgun | 674 (60%) | Handgun | 88 (59%) | 82 (57%) |
| Rifle or shotgun | 74 (25%) | 151 (15%) | Rifle or shotgun | 443 (40%) | Rifle or shotgun | 62 (41%) | 63 (43%) |
Firearm homicides of younger children were significantly more likely to be intimate partner violence–related (ie, related to conflict between intimate partners, such as violence between parents), to be incidents in which the victim was a bystander, to be related to a recent or impending crisis, and/or to be precipitated by family relationship problems. Firearm homicides of older children were significantly more likely to be precipitated by another crime, to be gang-related, to have drug involvement, and/or to involve weapon use also on the part of the victim.
Firearm suicides among children were often precipitated by situational factors such as a crisis in the past or upcoming 2 weeks (42%) and relationship problems (71%) with an intimate partner, friend, or family member. Mental health factors were also evident: 34% had a depressed mood at the time of their death, 26% had a clinically diagnosed mental health problem, and 18% were receiving mental health treatment at the time of death. More than a quarter (26%) disclosed their intent to die by suicide to someone before the incident. Approximately 60% of the firearm suicides were completed with a handgun.
Both younger and older children were more likely to be unintentionally shot and killed by someone else than from an unintentional self-inflicted injury, although the proportion unintentionally shot by someone else was higher for older children (71%) than for younger children (56%). When the fatal injury was from another person, the shooter was most often another younger child (54%) in deaths of children aged 0 to 12 years. Older children were mostly shot by someone similar in age (62% of shooters were aged 13–17 years), followed by shooters age 18 to 24 years (19%) or less than age 13 (13%). The majority of both younger and older children were fatally injured in a home.
The most common circumstance surrounding unintentional firearm deaths of both younger (60%) and older children (49%) was playing with a gun. Older children, relative to younger children, more often died in incidents involving showing a gun to others and/or mistakenly thinking the gun was unloaded or the safety was engaged. A gun was mistaken for a toy in 16% of younger children’s deaths and in only 1 death involving an older child. Approximately the same percentage of deaths of younger and older children occurred while hunting or target shooting (14% and 17%, respectively). The majority of both younger and older children were fatally injured in a home. The proportion involving a handgun was similar for younger and older children (59% and 57%, respectively).
Discussion
International studies indicate that 91% of firearm deaths of children aged 0 to 14 years among all high-income countries worldwide occur in the United States, making firearm injuries a serious pediatric and public health problem in the United States.14 The findings in this article highlight the magnitude and characteristics of firearm injuries among children in the United States. Approximately 19 children a day die or are medically treated in an ED for a gunshot wound in the United States. The majority of these children are boys 13 to 17 years old, African American in the case of firearm homicide, and white and American Indian in the case of firearm suicide.
Firearm homicides of children have different contexts depending on age. Firearms have been a prominent factor in assaults, crime, and homicide involving young males, particularly ethnic minority males, for decades.15–18 Findings based on the NVDRS data indicate that firearm homicides among older children were more likely to be precipitated by another crime, to be gang-related, and to have drug involvement, which is consistent with other research on youth violence.19 As seen in this and other studies, younger children are often “caught in the crossfire,” whether as innocent bystanders to community violence or during incidents of intimate partner violence and family conflict.20 Previous research indicates that these “corollary victims” may be killed in an act of retaliation against an intimate partner of the perpetrator20 and are much more likely to be killed in a homicide followed by suicide of the perpetrator compared with older children and the general population of homicide victims.21
Child firearm suicides were most often precipitated by acute crises and life stressors such as relationship, school, and crime problems. Programs that help children and youth manage emotions and develop skills to resolve problems in relationships, school, and with peers can reduce adolescent suicidal behavior and improve help-seeking and coping skills.22,23 These types of programs have also demonstrated preventive effects on peer violence and dating violence among teenagers.24 Mental health factors were also evident in firearm suicides among children. Pediatricians and other primary care providers can play an important role in screening for depression25 and other behavioral health risks, such as alcohol misuse,26 to help adolescents receive appropriate care and follow-up. It is also important to address the availability of lethal means during a dispute or in times of crisis. Suicides are often impulsive in this age group, with previous findings indicating that many who attempt suicide spend 10 minutes or less deliberating.27,28 The high case fatality rate associated with firearm suicide attempts29 makes availability of highly lethal means in a time of crisis a crucial factor in determining whether a suicide attempt will be fatal. Safe storage practices (ie, unloading and locking all firearms and ammunition) can potentially be lifesaving in these instances. Previous studies indicate that these practices are protective against adolescent firearm suicide attempts and against unintentional firearm deaths in children.30 The evidence also suggests that state statutes that limit access to firearms among persons under a restraining order for domestic violence31,32 are associated with a reduced risk for intimate partner homicide overall and intimate partner homicide by firearm.31,32
Our findings indicate that most children who died of unintentional firearm injuries were shot by another child in their own age range and most often in the context of playing with a gun or showing it to others. Previous research shows that children are curious about firearms and will touch a firearm even when instructed not to do so,33 which points to the importance of adult supervision and the need to store firearms safely and out of the reach of children. More than one-third of the deaths of older children occurred in incidents in which the shooter thought that the gun was unloaded or thought that the safety was engaged, suggesting a lack of knowledge about the safe handling of a firearm and potentially a lack of adult supervision. Although many states have child access prevention laws, which are designed to limit children’s unsupervised access to a firearm, the laws vary in terms of their limits of liability and in their effectiveness, with effects noted for firearm suicides in children ages 14 to 17 years and in unintentional firearm deaths to children less than the age of 15.34
Consistent with previous findings for all age groups, firearm homicides of children tended to occur at higher rates in the South and parts of the Midwest, particularly in states in which high rates of youth homicide have been previously reported.35 The findings for firearm suicide reflect the larger, more widespread problem of increased suicide rates across the nation, particularly after the economic downturn that began in 2007.36,37Although children have much lower suicide rates compared with other age groups, some of the steepest increases from 1999 to 2014 have been found among children 10 to 14 years of age.37 Unintentional firearm death rates have been steadily declining for several decades.12,38 Our findings are consistent with this overall trend.
It is important to remember that many types of violence are interconnected39 and that firearm violence does not stand in isolation when developing preventive interventions. There are a number of strategies to prevent violence. These include street outreach approaches such as Cure Violence and Safe Streets, which when implemented fully have been associated with reductions in gun violence, gang-related violence, homicide, and nonfatal assault-related injuries40,41; universal school-based programs as noted previously22–24; early childhood education, which has demonstrated long-term effects on youth involvement in serious violence and delinquency42,43; and therapeutic approaches, which have demonstrated impacts on adolescent suicidal behavior,44 youth gang involvement, felony arrests for violence,45,46 and the harms of violence exposures.47,48 It is also important to address poverty and the other contextual factors that mediate and moderate the risk for these forms of violence.49
The findings in this paper are subject to a few limitations. Firstly, unintentional firearm deaths may be significantly underreported in the CDC’s vital statistics system as other studies have noted.50 It is difficult to know the extent to which this underreporting differentially changes the victimization patterns reported here. Secondly, there is potential misclassification of certain racial and ethnic groups (eg, Hispanics, Asian Americans, and American Indians) in death certificate data.51 Estimates derived from these data may therefore underestimate victimization in these groups. The extent of missing data on race and ethnicity in NEISS precluded an examination of nonfatal firearm injuries by race and ethnicity. Nonfatal firearm injuries treated in settings other than hospital EDs and inpatient settings, or which are not medically treated at all, are also not included in this study. Finally, although NVDRS provides the only available detailed circumstance information related to violent deaths and unintentional firearm deaths, the findings reported here are based on data from states funded from 2003 to 2013 and are not nationally representative.
Conclusions
Pediatric firearm injuries and deaths are an important public health problem in the United States, contributing substantially each year to premature death, illness, and disability of children. Understanding the nature, magnitude, and health impact of firearm violence against children is an important first step. Finding ways to prevent such injuries and ensure that all children have safe, stable, nurturing relationships and environments52 remains one of our most important priorities.
Authors : , , , ,
Source : http://www.aappublications.org/